







Why Interoperability Testing With Multiple eUICCs Matters
July 16, 2026
How SimplexAI Works: The Data Layers Behind Your IoT Network Questions
July 28, 2026
Coverage Maps Lie: How to Actually Verify IoT Cellular Coverage Before You Deploy
Stop trusting the map. Start trusting the device.
The coverage map showed full bars. You deployed 300 devices. Half of them couldn’t connect. If you’ve been through this once, you don’t want to go through it again. If you haven’t — this article is how you avoid it.
Why Coverage Maps Are Built for the Wrong Device
Carrier coverage maps are not dishonest. They’re just optimized for a different device than yours.
The data behind them is collected from handsets held at roughly head height, outdoors, moving through streets and roads. Signal models are then extrapolated to fill in the areas between measurement points. The result is an accurate picture of whether someone standing outside at an intersection can make a phone call. It is not a reliable picture of whether your device, in its actual enclosure, at its actual mounting location, can maintain a stable data session.
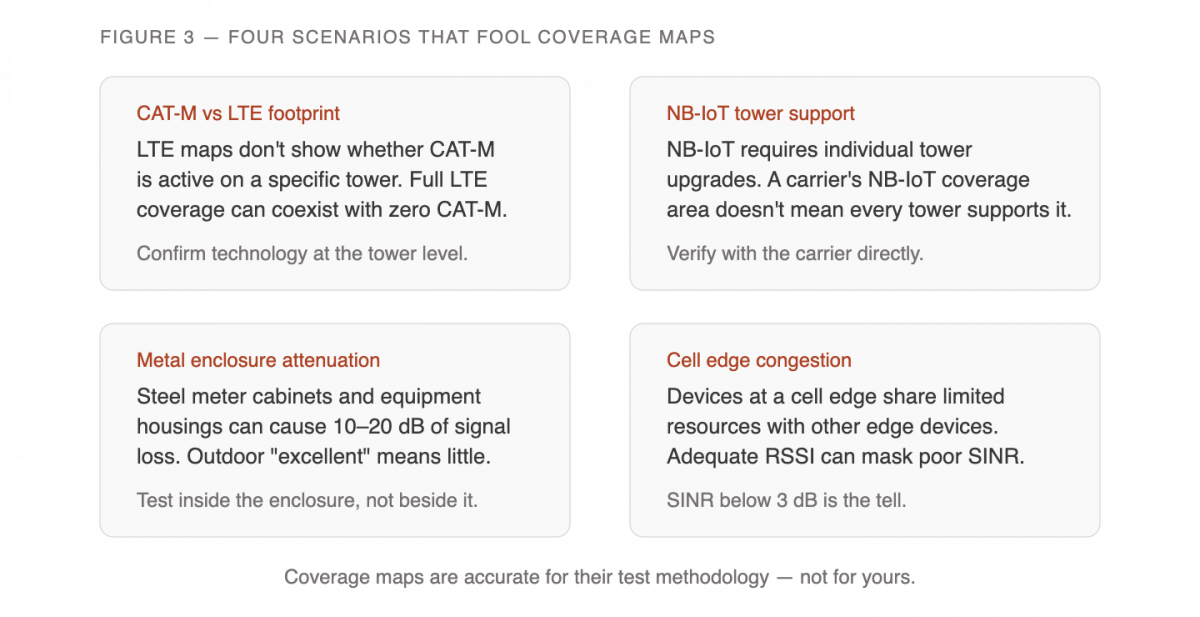
IoT devices defy almost every assumption built into that model. They sit in locked metal utility boxes where RF signal loses 10–20 dB passing through the enclosure walls. They’re bolted to concrete ceilings in parking structures, buried in equipment racks, mounted on rooftops in areas that appear geographically covered but sit on the wrong side of a ridge. They don’t move, so they can’t self-correct by drifting toward a better signal. And they don’t have a user who notices when something is wrong.
A coverage map that reads “excellent” in your deployment area may be completely accurate for the carrier’s test methodology and completely useless for your use case.
The Indoor Penetration Problem
This is where most deployments get surprised. Coverage that looks solid outdoors can be significantly weaker inside a metal utility box, behind reinforced concrete, or in a basement equipment room.
Signal attenuation varies by construction material. Wood-frame interiors cause modest loss. Concrete floors and walls cause significant loss. Metal enclosures cause severe loss. A device inside a steel meter cabinet in an area shown as “good coverage” may be operating with a signal that would cause frequent disconnections or prevent registration entirely.
The penetration problem compounds with frequency band selection. Higher frequency bands (like many 5G bands) penetrate building materials less effectively than lower frequency bands. CAT-M and NB-IoT operate on low-band spectrum specifically to improve penetration and range, which is part of why they’re designed for IoT. But even within CAT-M coverage, whether a specific tower supports CAT-M on its low-band carriers matters, and coverage maps often don’t distinguish between LTE coverage and CAT-M availability on a tower-by-tower basis.
What Signal Metrics to Measure — and What They Mean
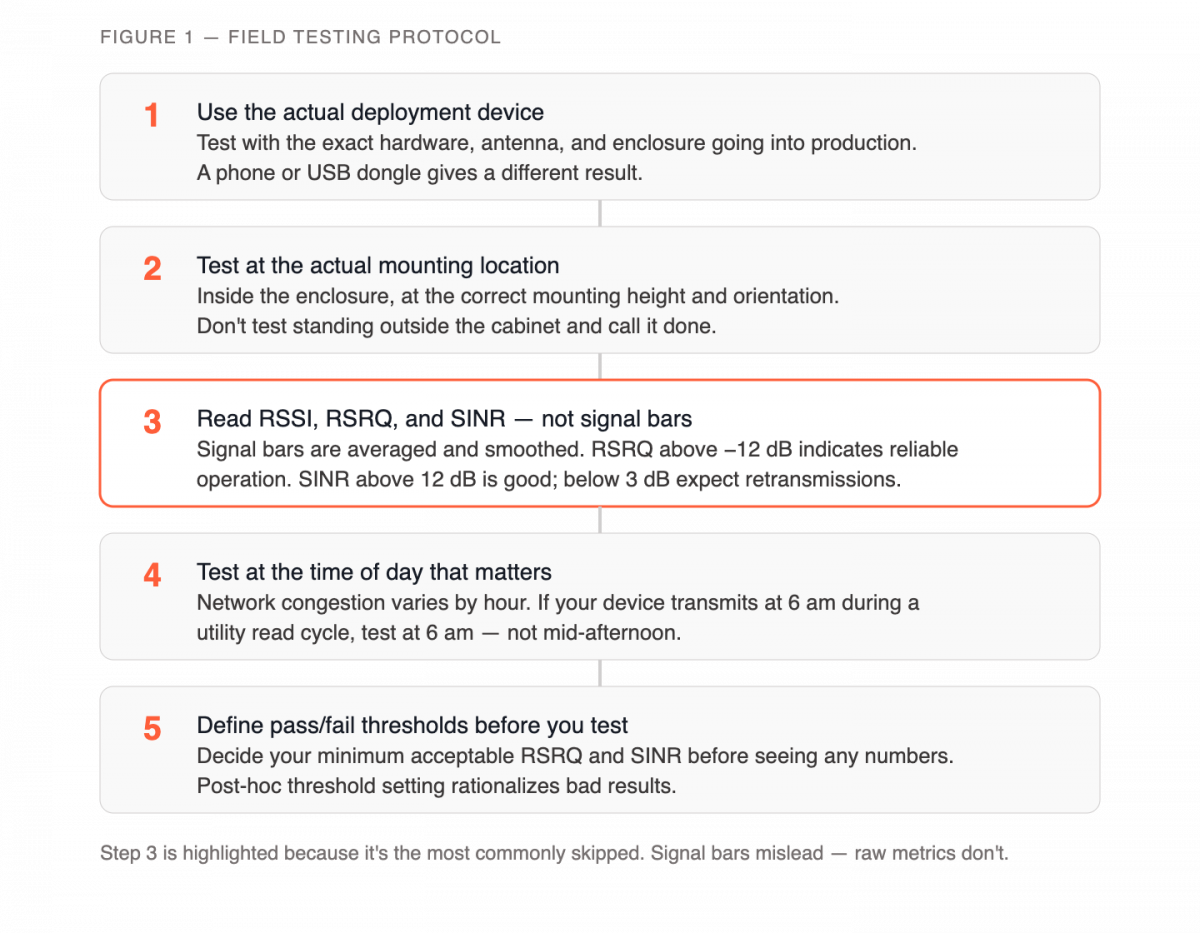
Coverage maps give you a qualitative picture. Field testing gives you numbers. The three that matter for LTE-based IoT connectivity are RSSI, RSRQ, and SINR.
RSSI (Received Signal Strength Indicator) is total received signal power including interference and noise. It’s a reasonable proxy for whether a signal exists, but not for whether it’s usable. A location can have a strong RSSI and still have poor throughput if the interference level is high.
RSRQ (Reference Signal Received Quality) measures signal quality relative to total noise. It’s more diagnostic than RSSI. For most IoT applications, an RSRQ above -12 dB indicates reliable operation. Below -15 dB, expect intermittent connectivity.
SINR (Signal-to-Interference-plus-Noise Ratio) is the clearest indicator of data throughput potential. Above 12 dB is good for IoT. Between 3 and 12 is acceptable. Below 3 dB, and you’re likely to see frequent retransmissions and latency spikes.
These values are readable via AT commands on most IoT modules. On Quectel modules, AT+QCSQ returns the relevant values. On Sierra Wireless, AT!GSMINFO. On Telit, AT#MONI. If you don’t know the AT command for your module, the manufacturer’s AT command reference has it. Most field engineers use a laptop, USB-to-serial adapter, and a terminal application for this during site surveys.
The Multi-Carrier Advantage in Coverage Testing
This is where the SIM you use for testing changes what you learn.
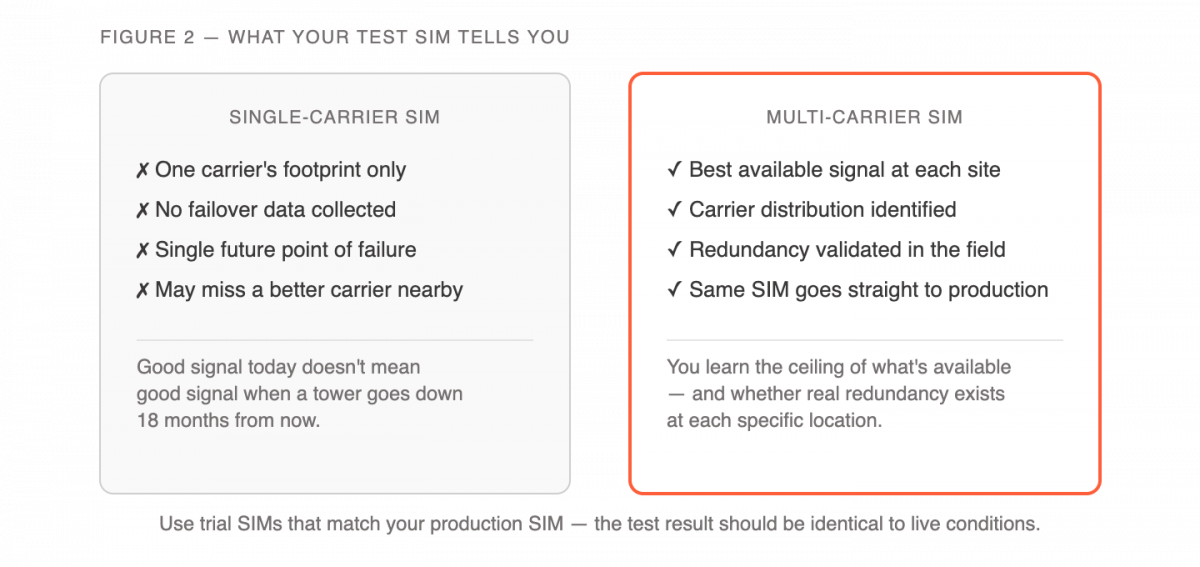
If you test with a single-carrier SIM, you’re learning whether one carrier performs adequately at your deployment locations. If that carrier has a bad tower or an outage six months from now, you’ll find out when your devices go offline.
Testing with a multi-carrier SIM tells you the best available signal at each location across all the carriers the SIM can access. You’re testing the ceiling of what’s available, not one carrier’s floor. At locations where multi-carrier coverage is excellent, you have genuine redundancy. At locations where even multi-carrier coverage is marginal, you’ve identified a deployment risk before you’ve committed hardware.
A trial SIM from your intended provider is the right tool for site surveys. Most quality IoT SIM providers will send trial SIMs before a deployment commitment. If a provider requires volume commitment before you can test, that’s worth noting.
Four Edge Cases That Fool Coverage Maps
Understanding how carrier selection and multi-carrier networks actually work helps you anticipate where maps mislead. These four cases account for a large share of surprise failures in the field.
How to Sample Before You Scale
Full pre-deployment coverage testing across every location isn’t always feasible. For large deployments, a sampling approach is both practical and effective.
Test 5–10% of planned deployment locations before committing the fleet. Choose the sample to represent the range of conditions your deployment will encounter: rural and urban locations, indoor and outdoor, above-grade and below-grade, high-rise and ground-floor. If your deployment spans multiple regions, sample from each region.
At each sampled location, run the device for at least 24 hours of active connectivity and log the signal metrics and connection stability. You’re looking for two things: locations where average RSRQ is consistently below -15 dB (marginal coverage), and locations where the device drops and reconnects more than two or three times per day without obvious cause.
For large-scale deployments, sampling 5–10% before committing hardware catches coverage gaps that would otherwise require truck rolls to fix. The cost of 30 site visits is far lower than the cost of dispatching field technicians to 300 under-performing devices.
If your sampled locations show consistently strong RSRQ and SINR, you can deploy the remaining locations with reasonable confidence. If sampled locations cluster into “strong,” “marginal,” and “no-go” categories, you have the data to make site-specific decisions rather than a fleet-wide gamble.
What to Do When Coverage Is Marginal
Not every deployment location can be fixed by switching carriers. When field testing identifies a genuinely marginal site, you have three options worth considering.
The first is antenna optimization. External antennas mounted outside an enclosure, oriented toward the dominant tower, can recover 6–12 dB of signal in many installations. For fixed devices in permanent locations, an external antenna is often a cost-effective fix for marginal indoor coverage. Verify the antenna gain and connector type match your module’s specifications before purchasing.
The second is technology selection. If LTE coverage at a location is marginal, CAT-M may perform better because it operates on lower-band spectrum with better penetration characteristics, even if the LTE coverage map shows the same geographic footprint. Testing both technologies at a marginal location takes 20 minutes and may resolve the issue entirely.
The third is accepting the location as a known risk and planning accordingly. For non-critical monitoring devices, a site with occasional connectivity gaps may be acceptable if the data model can tolerate it. For safety-critical or revenue-generating devices, marginal coverage is a deployment blocker, not a deployment risk.
The right answer depends on what the device does and what the cost of a failed connection is. For a deep dive on quantifying that cost, the real cost of IoT connectivity failures post in this series covers the business-case math.
How Simplex Supports Coverage Validation
Simplex SIMs give you access to 500+ networks in 191 countries, including tier-1 carriers across North America. That coverage depth means you’re testing against the best available network at each location, not a single carrier’s footprint.
For pre-deployment validation, Simplex ships trial SIMs without unnecessary registration requirements. The SIM that goes into your test device is the same SIM you’ll deploy into production. There’s no APN change, no configuration difference, no gap between what you tested and what you deployed.
Once your fleet is live, the Simplex management portal gives you per-device signal and connectivity visibility. Devices that are struggling show up before they become support tickets. That’s the difference between a fleet you manage proactively and one you respond to reactively.
Coverage maps will keep being built for consumer handsets. That’s fine. Your job is to test for your device, in your enclosure, at your installation location. The tools to do that are straightforward. Use them before you deploy, not after.
Request a trial SIM at simplexwireless.com/iot-data-sim and test your actual deployment conditions before you commit the fleet.
This article was curated by Jan Lattunen, CCO Simplex Wireless
About the Author: Jan Lattunen manages Sales and Marketing for Simplex Wireless. Jan has 20 years’ experience in working with SIM card technology and was involved in launching the eSIM in North America with major carriers and OEMs. His expertise in telecommunications is around SIM cards. On a personal note, Jan is a family man and avid cyclist with advocacy for safety in the roads. You can connect with Jan on https://linkedin.com/in/JanLattunen